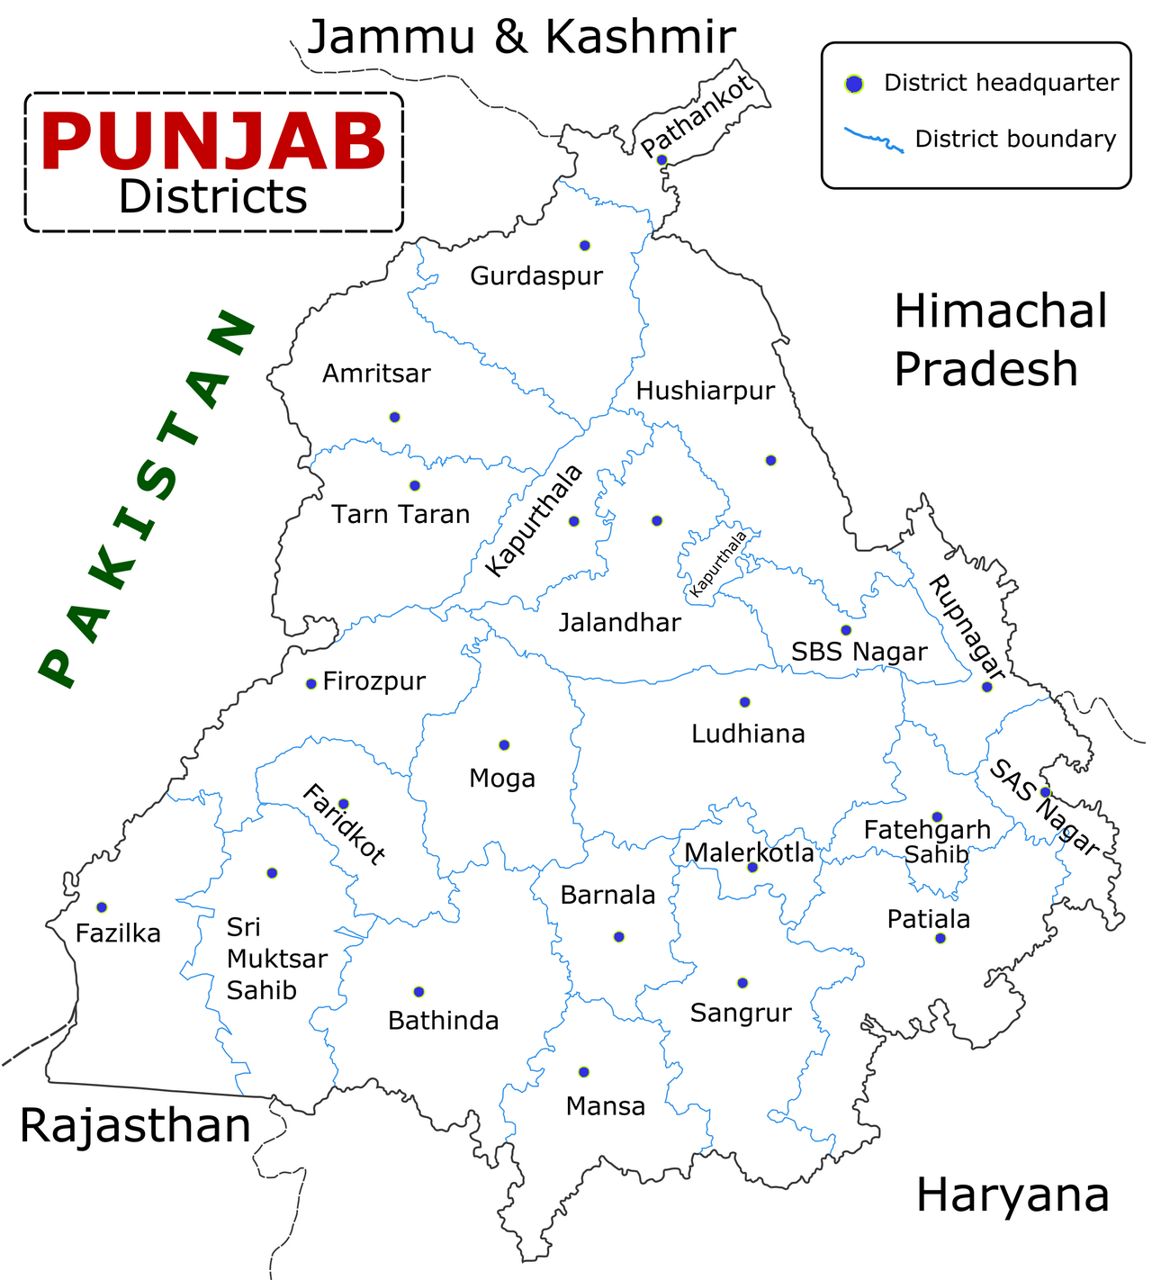
A census is a head-count of every person in the country. India counts its people every ten years. The last full count was Census 2011, so exam questions about Punjab's population, literacy and sex ratio all use Census 2011 numbers. On this page you will learn: (1) Punjab's key numbers and what each one means, side by side with India; (2) religion, language and the three regions; (3) the district records — highest and lowest — shown on a map.
Punjab at a glance
Learn this table first. Almost every census question comes from it.
| Indicator | Punjab, Census 2011 — remember |
|---|---|
| Total population | 2,77,43,338 (about 2.77 crore) — 16th among today's states (15th in the 2011 list); about 2.3% of India |
| Males / Females | 1,46,39,465 / 1,31,03,873 — More males than females |
| Decadal growth (2001–2011) | 13.89% — Lower than India's 17.7% |
| Density | 551 persons per sq km — Provisional figure was 550 |
| Sex ratio | 895 females per 1,000 males — India: 943 |
| Child sex ratio (age 0–6) | 846 — Lower than the overall 895 |
| Literacy (total) | 75.84% — Provisional figure was 76.68% |
| Male literacy | 80.44% — Higher than female |
| Female literacy | 70.73% — About 9.7 points below male |
| Urban population | 37.48% — About 3 in every 8 people |
| Rural population | 62.52% — Most people live in villages |
| Scheduled Castes (SC) | about 31.9% — Highest share of any state |
In Census 2011, male literacy (80.44%) was higher than female literacy (70.73%) in Punjab. The state's total literacy (75.84%) was a little above the national figure (74.04%).
Literacy: "80 men, 70 women, 75 together" (80.44 / 70.73 / 75.84). Sex ratio: 895 girls for every 1,000 boys in the whole state, but only 846 among small children (0–6) — the child figure is always the smaller one.
- 551
- Density — persons per sq km (India 382)
- 895
- Sex ratio — females per 1,000 males (India 943)
- 846
- Child sex ratio, ages 0–6
- 13.89%
- Population growth, 2001–2011
- 75.84%
- Total literacy (India 74.04%)
- 80.44% / 70.73%
- Male / female literacy
- 62.52% / 37.48%
- Rural / urban share
- 57.69%
- Sikh share of the population
- 31.9%
- Scheduled Castes — highest share of any state
- 4.75%
- Multidimensionally poor (NITI Aayog, 2023)
Growth, sex ratio, villages
What the main numbers mean.
Decadal means "over ten years". The decadal growth rate is how much the population grew between two censuses. Punjab grew by 13.89% from 2001 to 2011, slower than India as a whole (about 17.7%).
Sex ratio = number of females for every 1,000 males. Punjab's is 895. Child sex ratio counts only children aged 0–6. Punjab's is 846 — even lower, which shows that fewer girls than boys are born (because of sex-selection before birth) and survive.
Religion, caste and language
Only what Census 2011 and the law say.
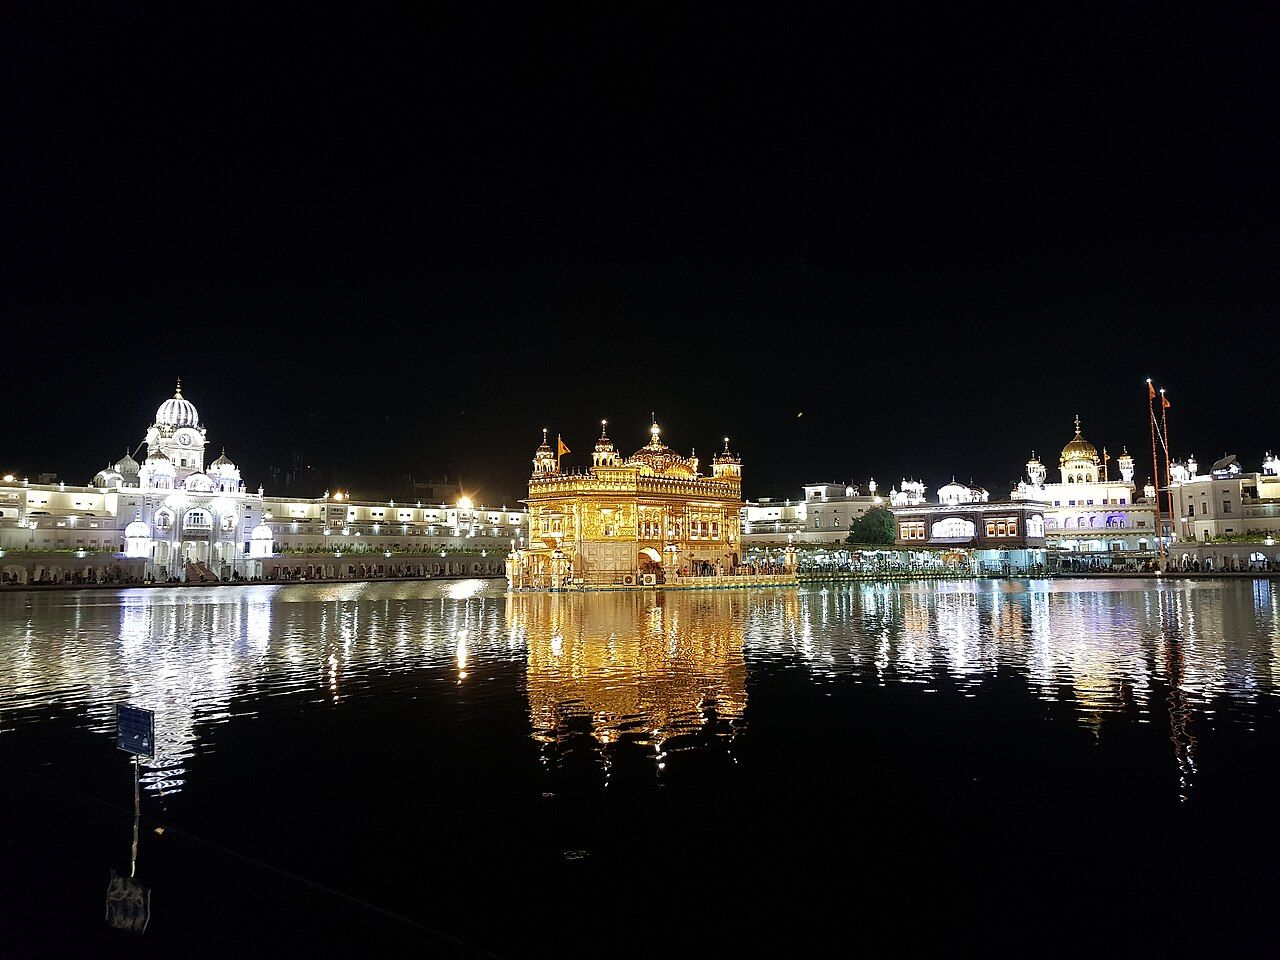
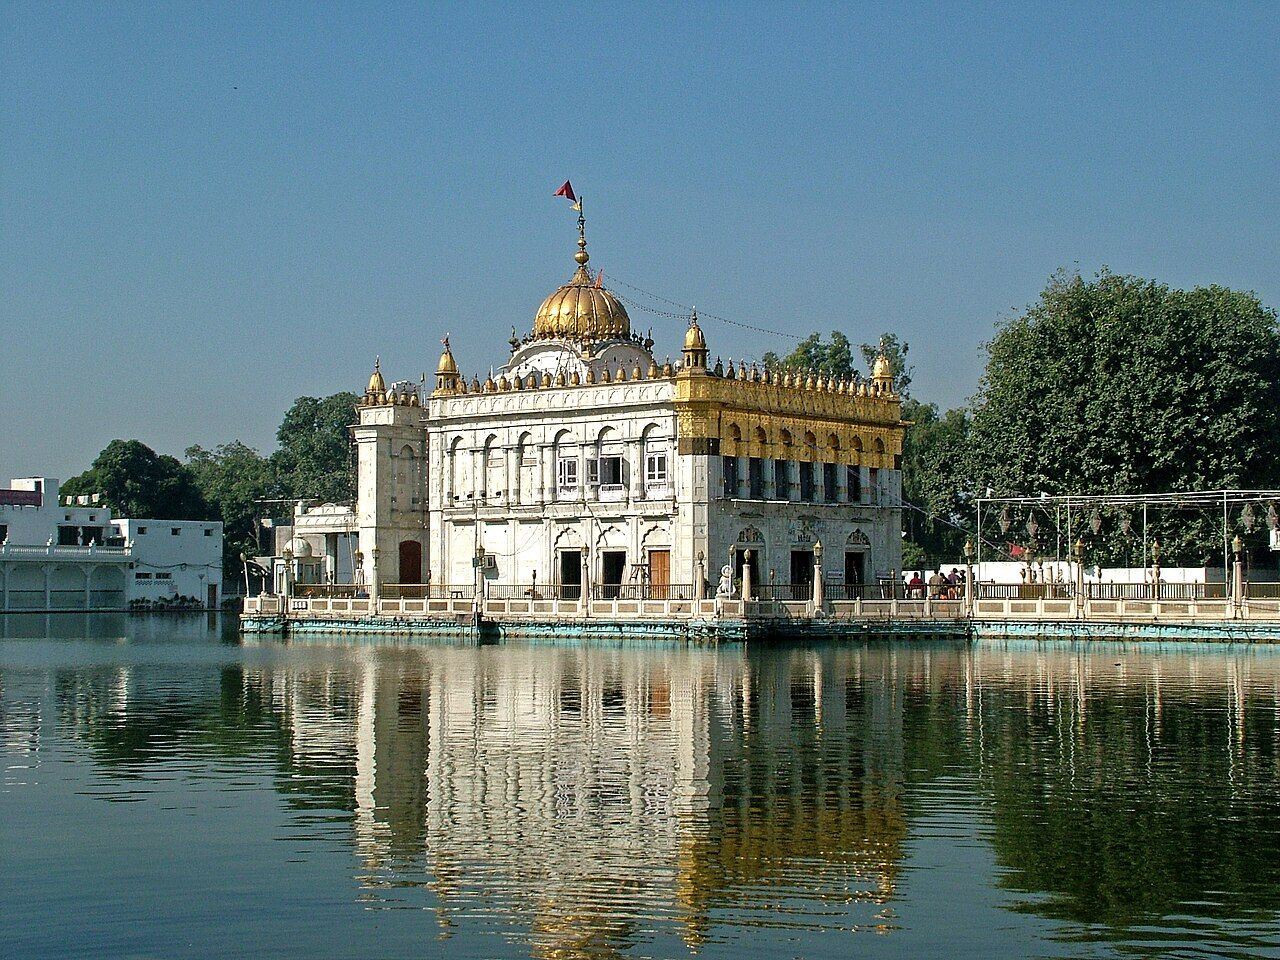
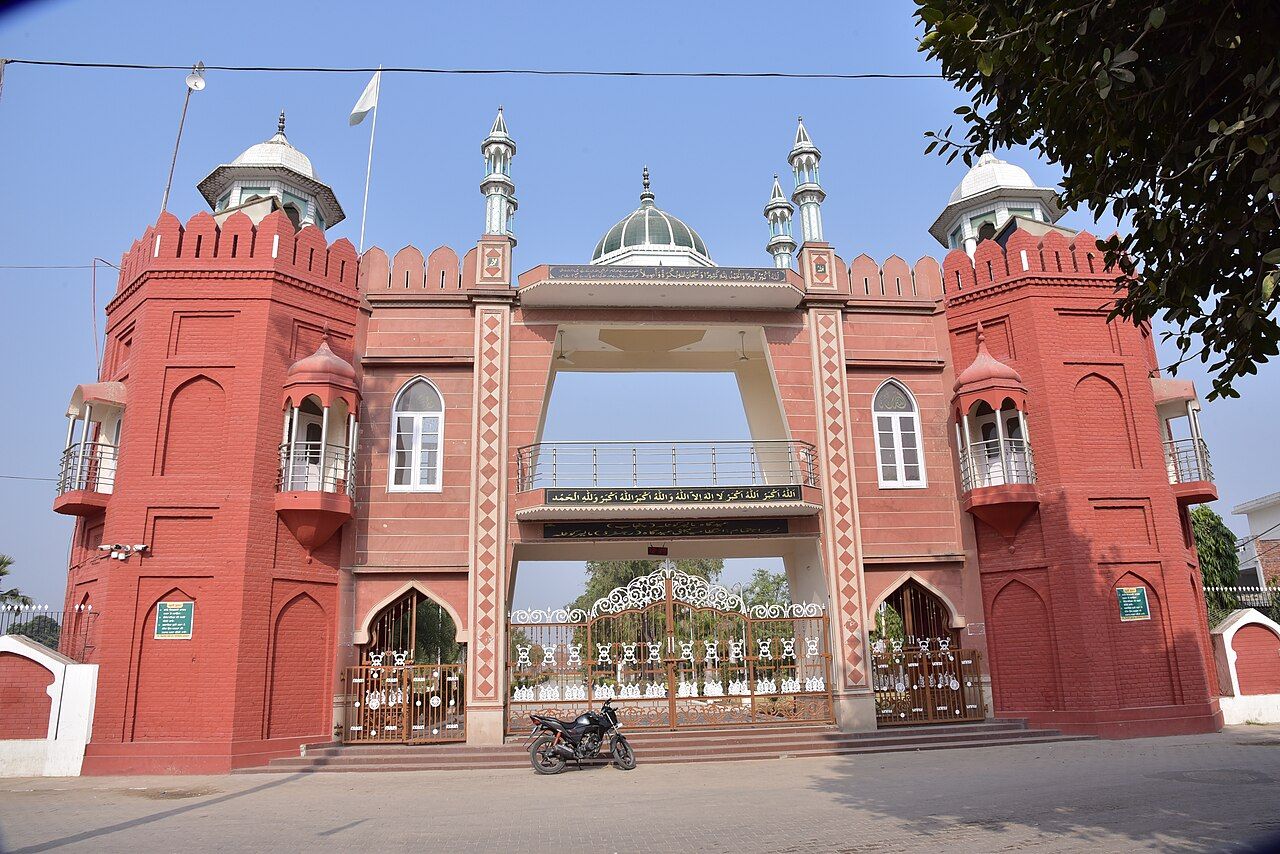
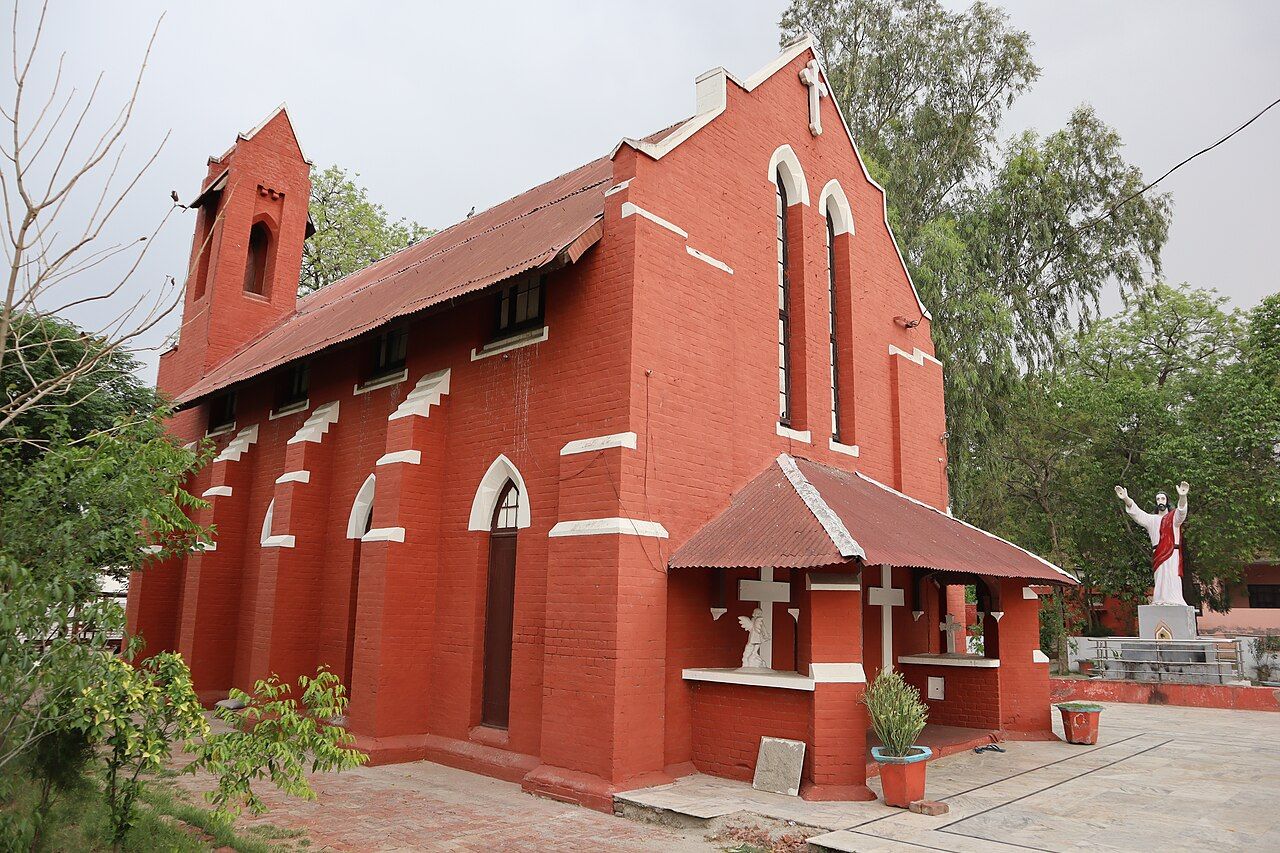
Scheduled Castes form about 31.9% (nearly one-third) of Punjab's population — the highest share of any state in India (Census 2011).
- Official language: Punjabi, written in the Gurmukhi script. The Punjab Official Language Act, 1967 made it the state's official language; amendments in 2008 made its use in offices and courts stricter. See Punjab after 1947.
- Gurmukhi was given its standard form by Guru Angad Dev. It is not Devanagari, Roman or Shahmukhi.
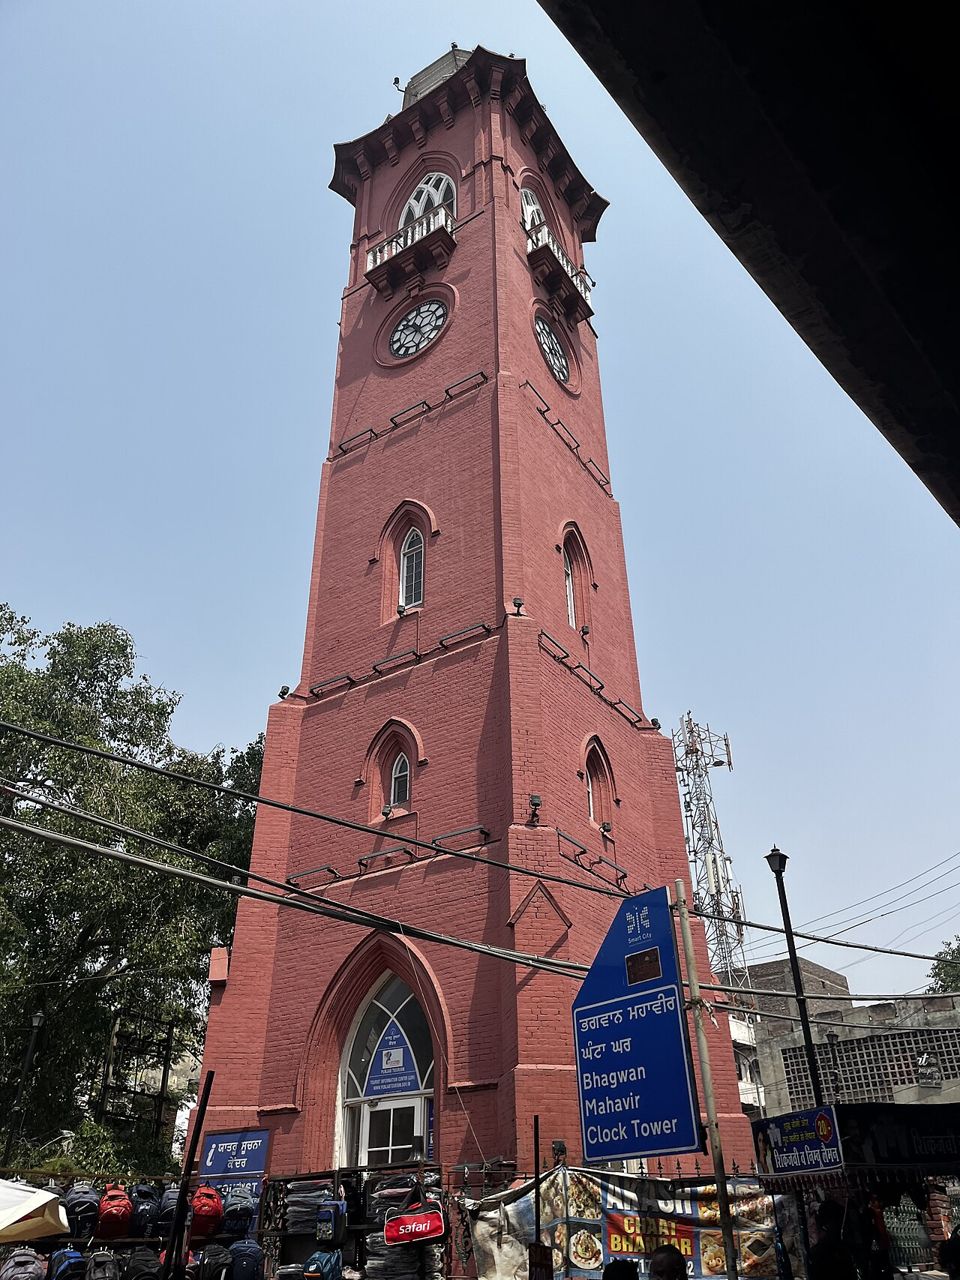
Dialects and traditional dressTap to open
- Main dialects: Majhi (Majha — the base of standard Punjabi), Doabi (Doaba), Malwai (Malwa) and Puadhi (Puadh).
- Traditional dress: women wear the Patiala salwar suit (salwar, kameez and dupatta); men wear kurta with chadra and a turban.
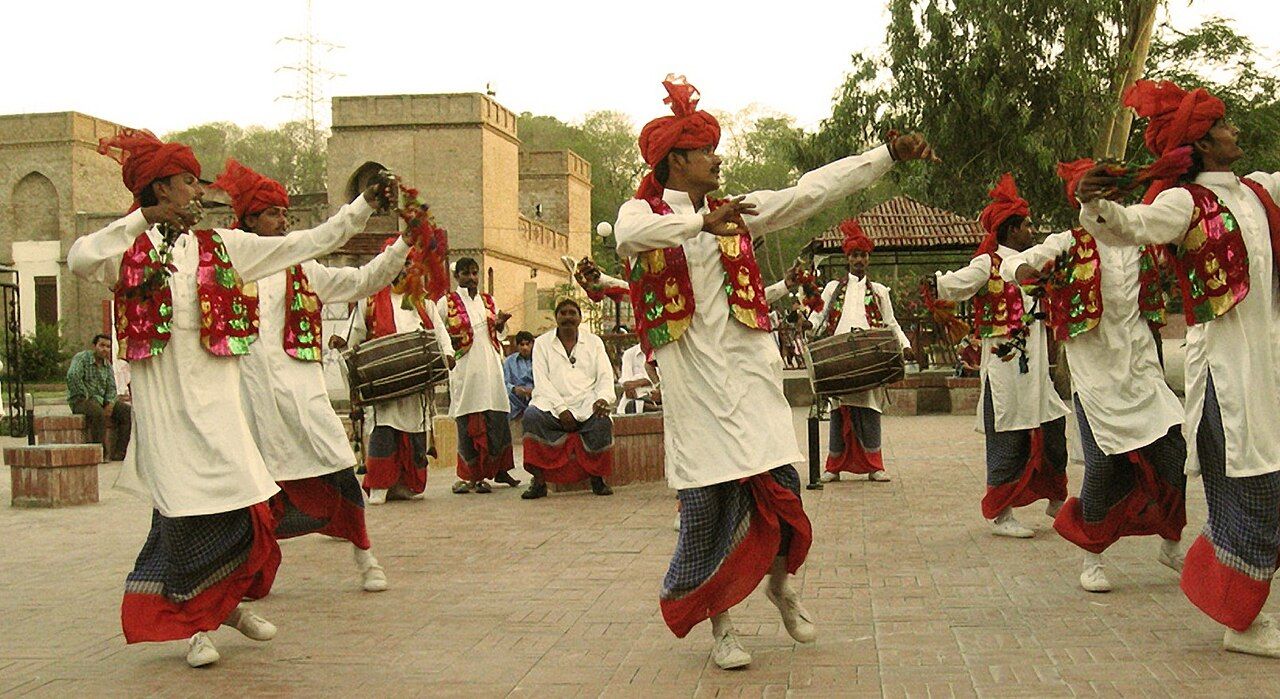
Regions and population
The three big regions — Majha, Doaba and Malwa — are named after the rivers.
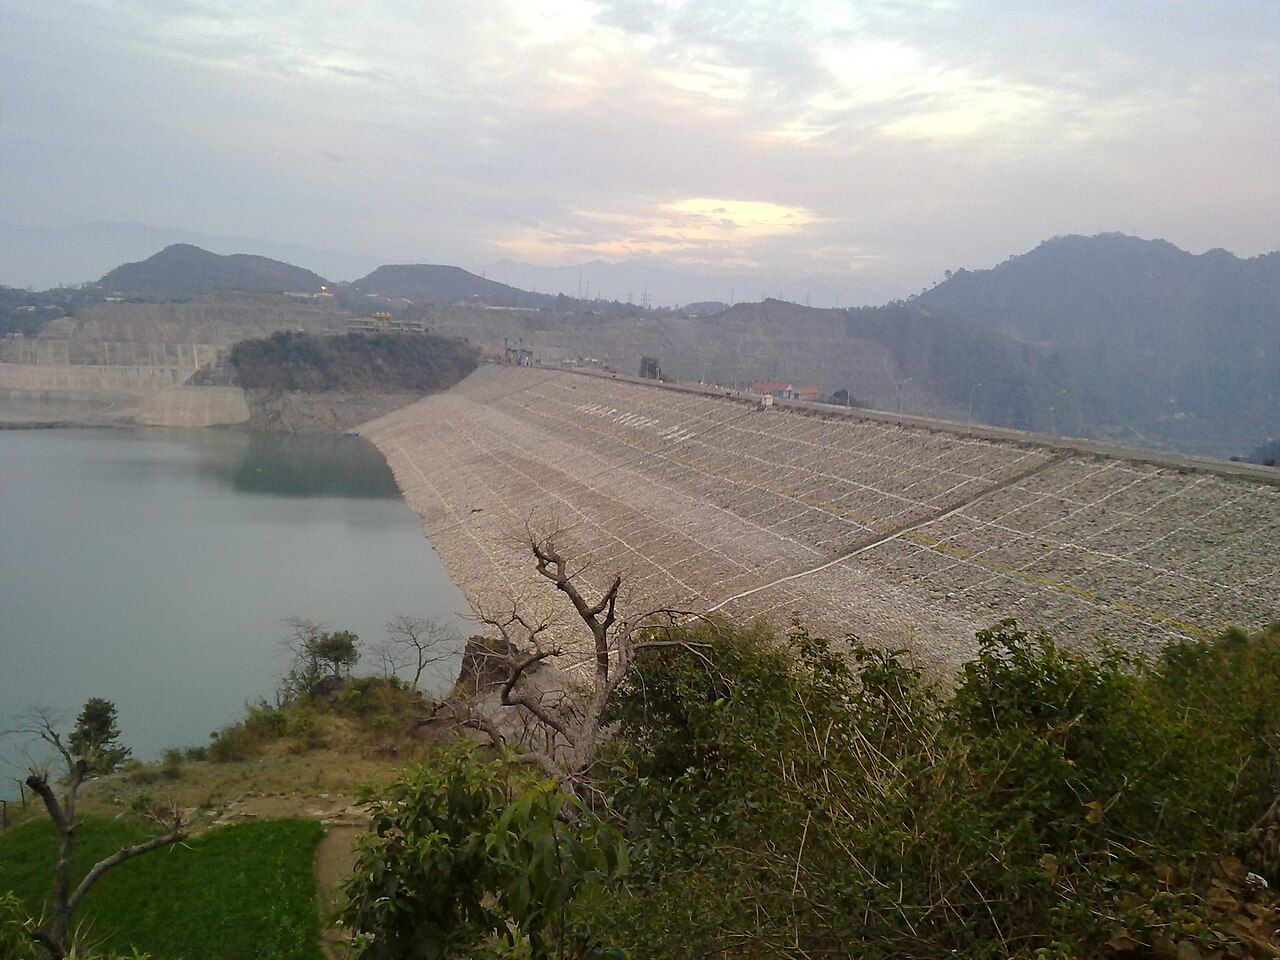
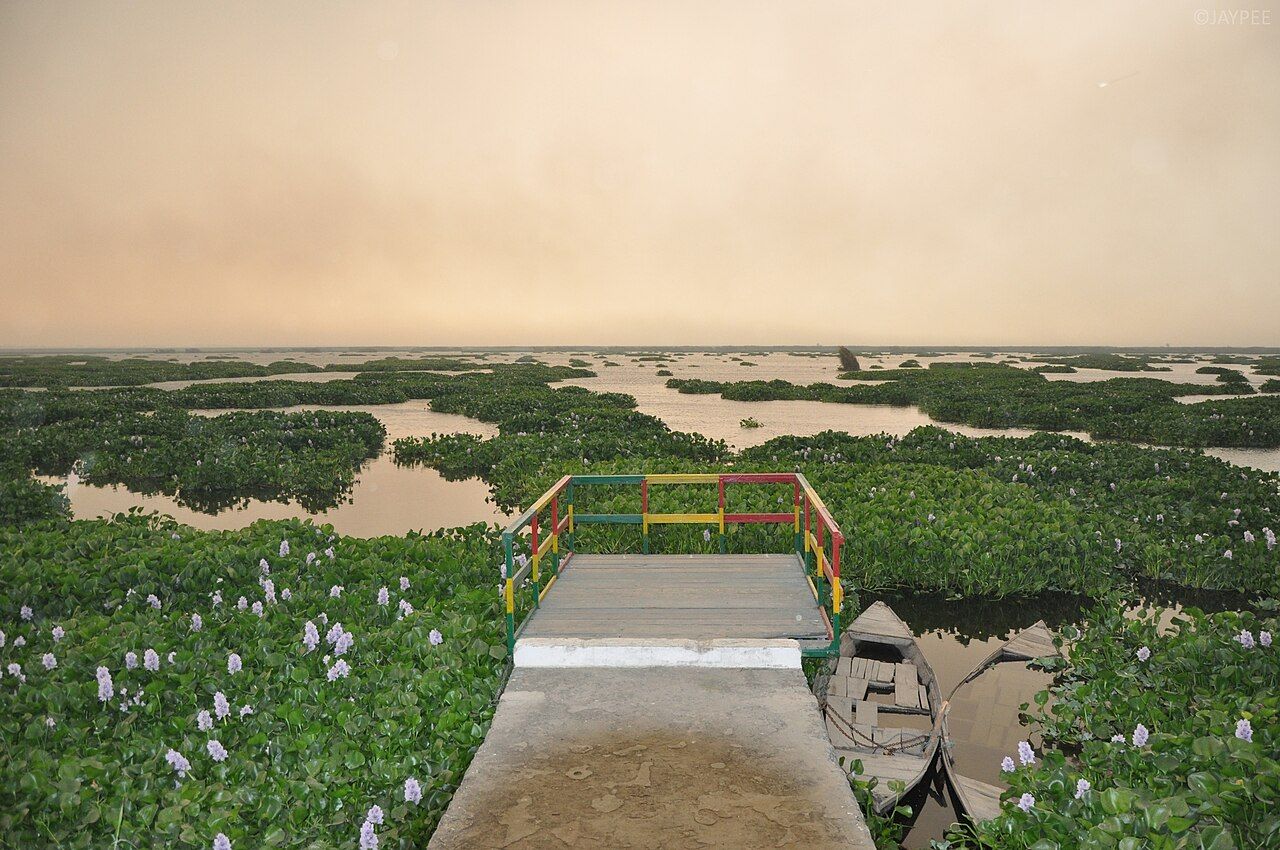
Puadh, and the full region tableTap to open
| Region | Lies between | Districts | Population fact |
|---|---|---|---|
| Majha | Ravi and Beas | Amritsar, Tarn Taran, Gurdaspur, Pathankot (4) | Amritsar is the 2nd most populous district |
| Doaba | Beas and Sutlej ("land of two rivers") | Jalandhar, Hoshiarpur, Kapurthala, SBS Nagar (4) | Highest NRI density; Hoshiarpur tops literacy and sex ratio |
| Malwa | South of the Sutlej | Ludhiana, Patiala, Sangrur, Bathinda and 11 more (15) | Largest region by area and by population |
| Puadh | Between Sutlej and Ghaggar (east) | Rupnagar, SAS Nagar, parts of Fatehgarh Sahib and Patiala | Often counted inside Malwa |
District records
The highest and lowest districts — the most-asked census questions.
| Record (Census 2011) | Highest / largest | Lowest / smallest |
|---|---|---|
| Population | Ludhiana (34.9 lakh), then Amritsar | Barnala (5.96 lakh) among 2011 districts; Malerkotla today |
| Area | Ludhiana (3,767 sq km) | Malerkotla (837 sq km) today; Pathankot (929) next |
| Density | Ludhiana (975 per sq km), then Amritsar (932) | Sri Muktsar Sahib (348), then Mansa (350) |
| Literacy | Hoshiarpur (about 85%) | Mansa (about 62%) |
| Sex ratio | Hoshiarpur (961) | Bathinda (868) |
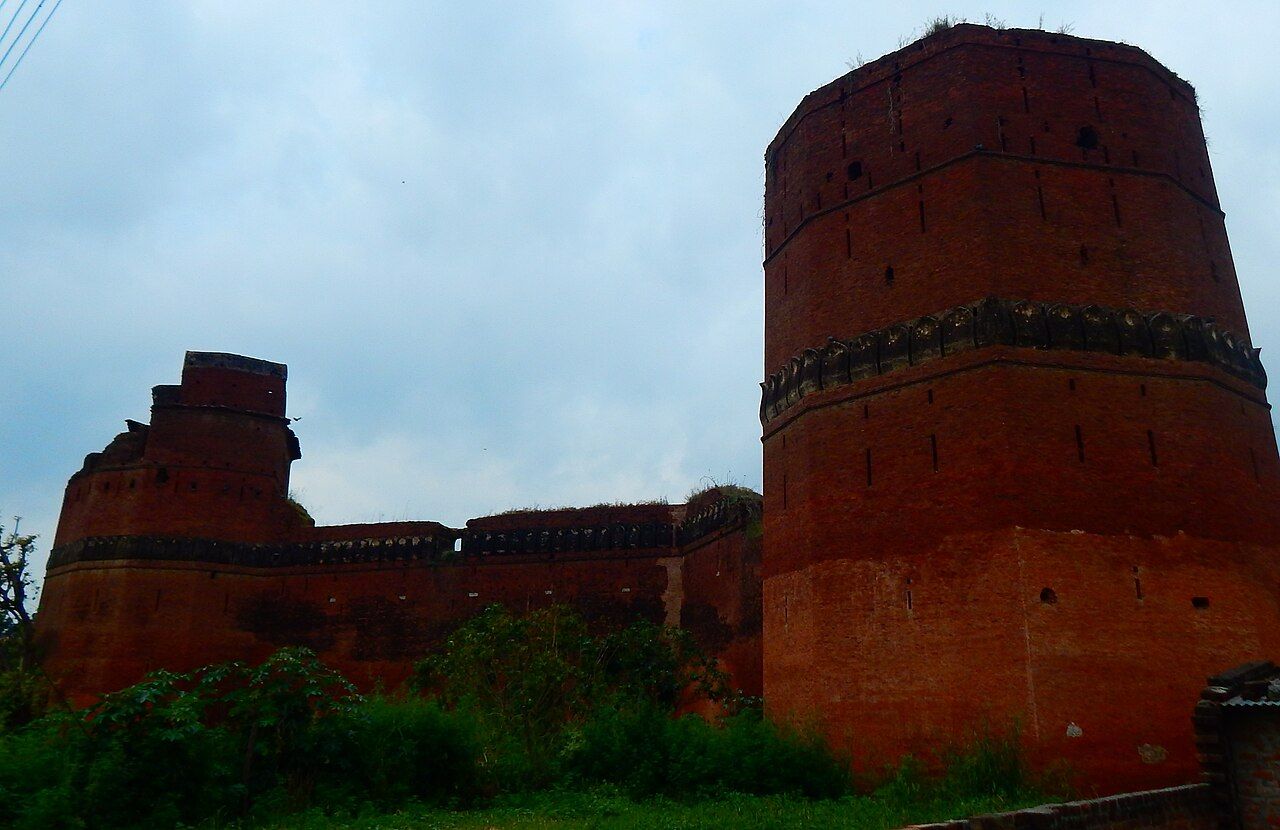
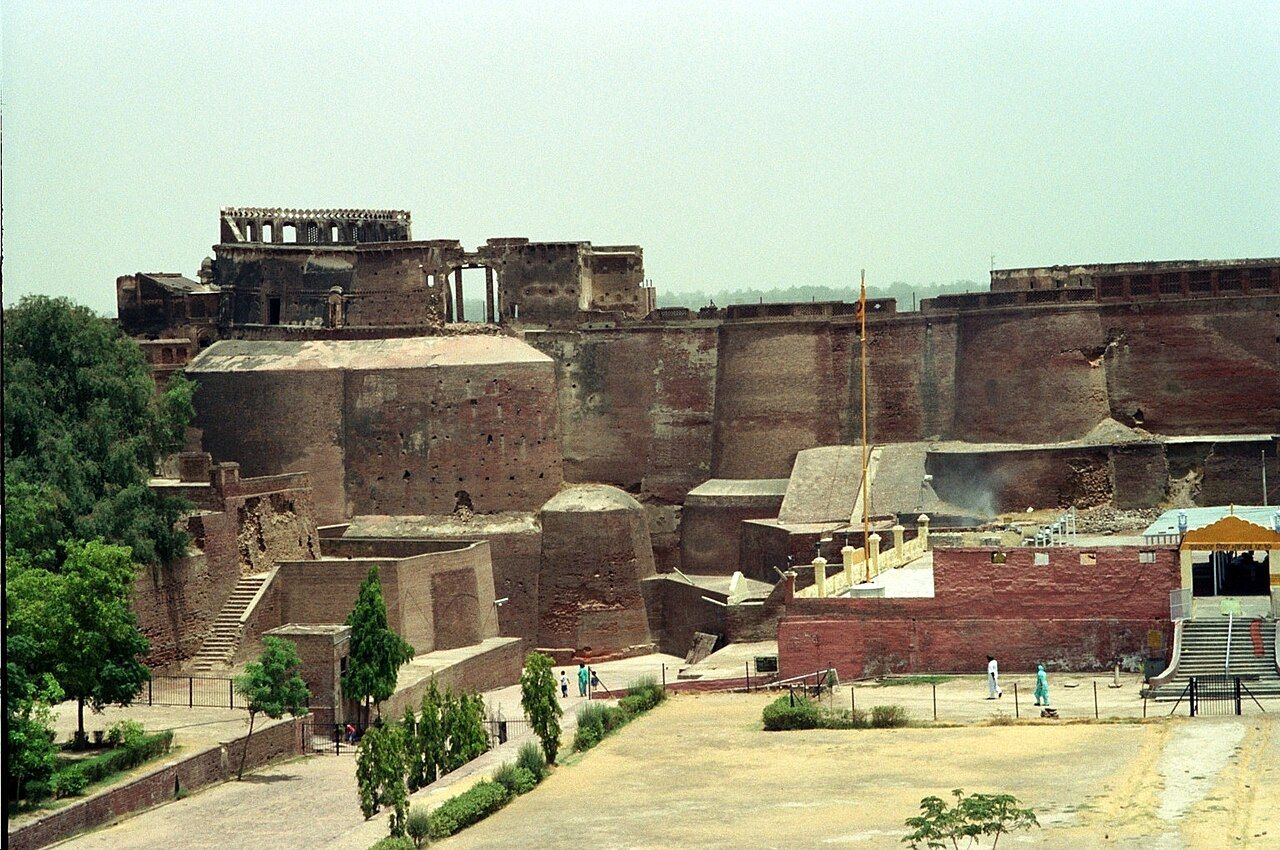
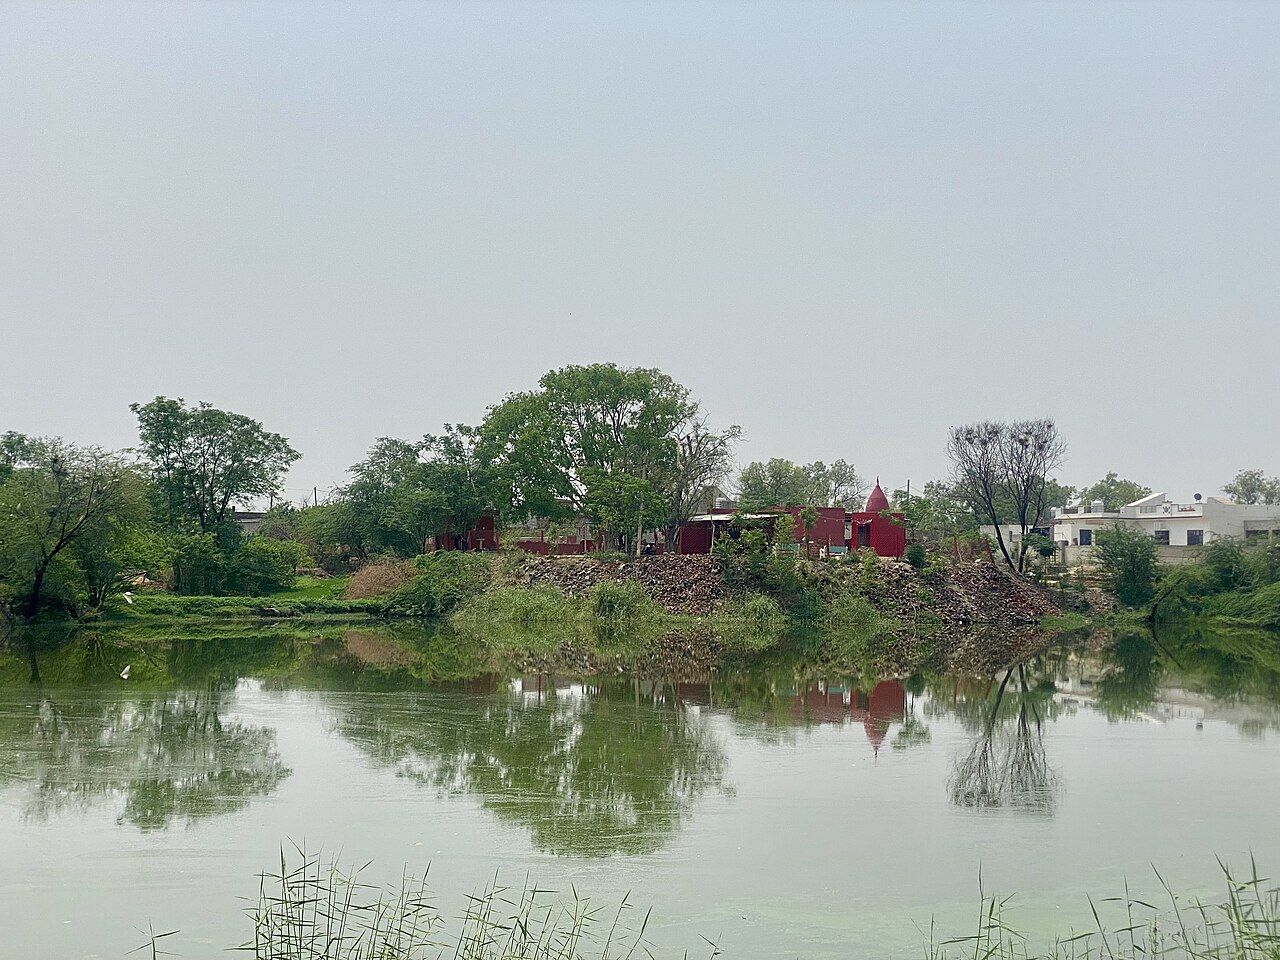
"Ludhiana is Large, Loaded and Packed; Hoshiarpur is Smart and Balanced." Large = area, Loaded = population, Packed = density; Smart = literacy, Balanced = sex ratio.
All 23 districts by population, and when new ones were madeTap to open
| District | Area (sq km) | Population 2011 |
|---|---|---|
| Ludhiana | 3,767 | 34,87,882 |
| Amritsar | 2,647 | 24,90,891 |
| Gurdaspur | 2,635 | 22,99,026 † |
| Jalandhar | 2,632 | 21,81,753 |
| Patiala | 3,218 | 18,92,282 |
| Hoshiarpur | 3,365 | 15,82,793 |
| Bathinda | 3,385 | 13,88,859 |
| Sangrur | 2,848 | 12,03,153 ‡ |
| Fazilka | 3,113 | 11,80,483 |
| Tarn Taran | 2,449 | 11,20,070 |
| Moga | 2,216 | 9,92,289 |
| SAS Nagar (Mohali) | 1,093 | 9,86,147 |
| Ferozepur | 2,190 | 9,65,337 |
| Sri Muktsar Sahib | 2,615 | 9,02,702 |
| Kapurthala | 1,632 | 8,17,668 |
| Mansa | 2,171 | 7,68,808 |
| Rupnagar (Ropar) | 1,369 | 6,83,349 |
| Pathankot | 929 | 6,76,598 |
| Faridkot | 1,469 | 6,18,008 |
| SBS Nagar (Nawanshahr) | 1,267 | 6,14,362 |
| Fatehgarh Sahib | 1,180 | 5,99,814 |
| Barnala | 1,410 | 5,96,294 |
| Malerkotla | 837 | about 4,52,016 § |
- 1992Fatehgarh Sahib and Mansa
Fatehgarh Sahib from Patiala; Mansa from Bathinda.
- 1995Moga, Muktsar and Nawanshahr
Moga and Muktsar from Faridkot; Nawanshahr renamed SBS Nagar in 2008.
- 2006Tarn Taran, SAS Nagar, Barnala
From Amritsar, Rupnagar and Sangrur.
- 27 July 2011Pathankot and Fazilka
21st and 22nd districts, from Gurdaspur and Ferozepur.
- 14 May 2021Malerkotla
23rd district, from Sangrur. Now the smallest and least populous.
Poverty and the economy
Two facts that come with census questions.
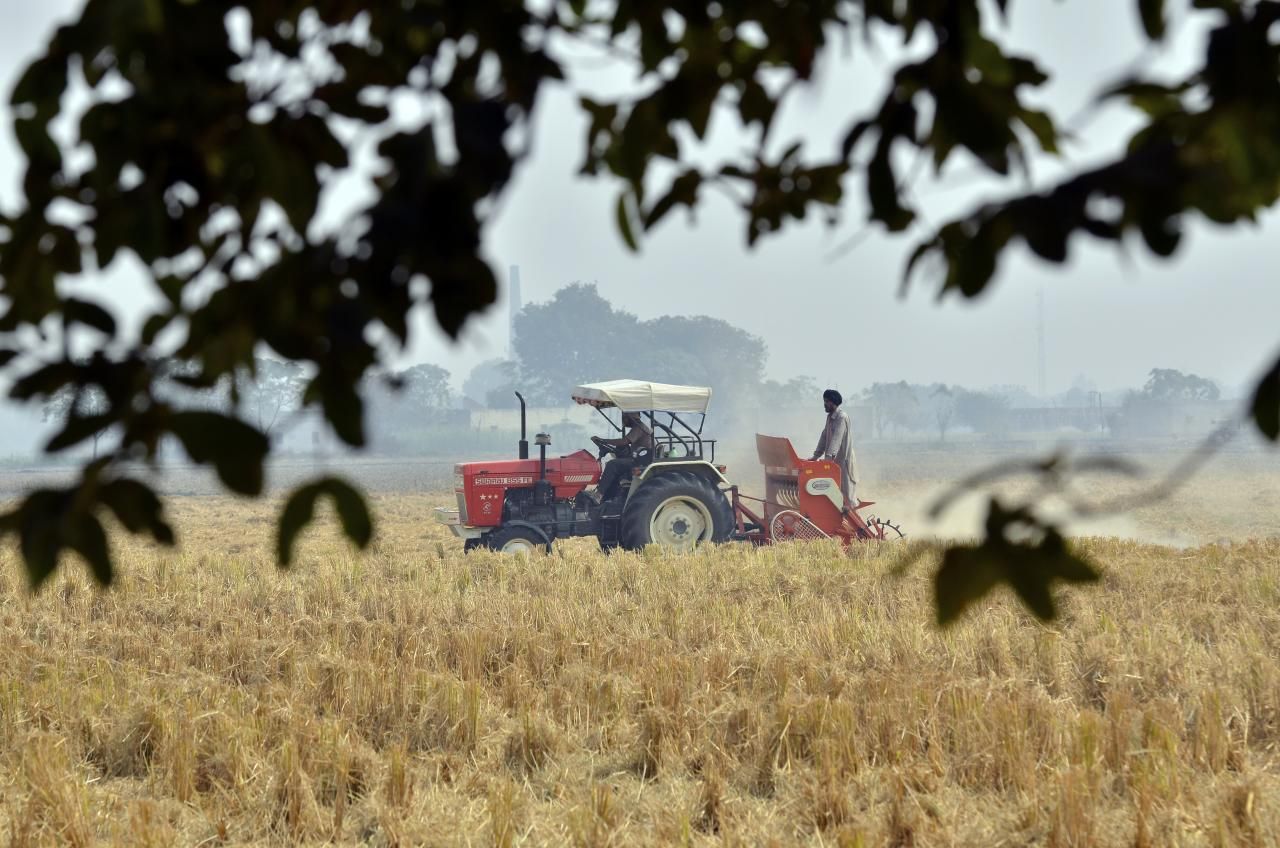
Punjab's economy is best known for agriculture. Fertile plains and canal irrigation made it the centre of the Green Revolution. (It is not known for coal mining, tea or deep-sea fishing.) See economy, industry and cooperatives. NITI Aayog's report "Multidimensional Poverty Index: A Progress Review 2023" found that 4.75% of Punjab's population was multidimensionally poor. Multidimensional means it looks at more than income — health, education and living standards too.
Common traps
- 75.84% is total literacy; 80.44% is male literacy; 70.73% is female literacy. Do not mix them.
- 895 is the overall sex ratio; 846 is the child (0–6) sex ratio.
- 37.48% is urban; 62.52% is rural.
- 13.89% is Punjab's growth from 2001 to 2011 — not its literacy or urban share.
- Old papers may show 76.68% literacy and density 550 — these were provisional figures. Final: 75.84% and 551.
- Second most populous district is Amritsar, not Jalandhar or Patiala.
- Highest literacy is Hoshiarpur, not Ludhiana. Lowest literacy is Mansa.
- Lowest sex ratio is Bathinda (868), not Mansa.
Quick revision
Read this the night before the exam.
- Population: 2,77,43,338 (2.77 crore)
- Rank by population: 16th of today's states (15th in 2011)
- Share of India: about 2.3%
- Decadal growth 2001–11: 13.89%
- Density: 551 per sq km
- Sex ratio: 895
- Child sex ratio: 846
- Literacy: 75.84% (India 74.04%)
- Male literacy: 80.44%
- Female literacy: 70.73%
- Urban: 37.48% · Rural: 62.52%
- Scheduled Castes: about 31.9% (highest of any state)
- Sikh 57.69% · Hindu 38.49%
- Christians: about 3.48 lakh (1.26%)
- Most populous district: Ludhiana; second: Amritsar
- Largest and densest district: Ludhiana
- Highest literacy and sex ratio: Hoshiarpur
- Lowest literacy: Mansa · Lowest sex ratio: Bathinda
- MPI 2023 (NITI Aayog): 4.75% poor
- Official language: Punjabi in Gurmukhi (Act of 1967)
As per Census 2011, what were Punjab's total, male and female literacy rates?
Show answer
Total 75.84%, male 80.44%, female 70.73%. Male literacy was higher, and the total was a little above India's 74.04%.
Name the most populous and the second most populous districts of Punjab (Census 2011).
Show answer
Ludhiana (about 34.9 lakh) is first and Amritsar (about 24.9 lakh) is second. Ludhiana is also the largest by area and the densest.
Which district had the highest literacy in Census 2011, and which had the lowest?
Show answer
Highest: Hoshiarpur (about 85%). Lowest: Mansa (about 62%). Hoshiarpur also had the best sex ratio (961).